Check out a newer version of this post! For more recent examples, head over to our latest online annual report showcase.

As more companies begin to go beyond print-only and compliment their annual reporting by presenting this information online, one of the first questions that may come up is “How do you make an interactive annual report?”
Many companies—from Facebook to Proctor & Gamble—host their annual reports online in straight-forward, archival pdf format. This direct strategy makes annual reports easy-to-download and simple to search; however, going with the pdf format limits what can be added with ease in the future and many times it doesn’t taking advantage of the Web’s interactive capabilities.
Many companies—from Facebook to Proctor & Gamble—host their annual reports online in straight-forward, archival pdf format. This direct strategy makes annual reports easy-to-download and simple to search; however, going with the pdf format limits what can be added with ease in the future and many times it doesn’t taking advantage of the Web’s interactive capabilities.
Some innovative companies incorporate online technologies to create engaging presentations of their annual report content, often creatively using responsive designs and embedding video. This trend is growing. According to Savage Brands, “electronic/online annual report budgets increased 30% over 2010,” and “online tracking of [annual] reports has increased 60% between 2008 and 2012; 80% of those that track do so to improve the follow year’s budget.”
Here are four great examples of interactive annual reports:
| (Screengrab from Warby Parker’s 2013 interactive annual report website, via warbyparker.com) |
Warby Parker
Instead of a simple summary of 2013, Warby Parker uses a grid-like format to share its online annual report data. The report chronicles all 365 days of the past year—including both its many successes and its few missteps. |
| (Screengrab from Kellogg’s 2012 interactive annual report website, via kelloggcompany.com) |
Kellogg
Kellogg’s online annual report includes an interactive 10-K, the report that provides a complete summary of a company’s financial performance, as required by the US Securities and Exchange.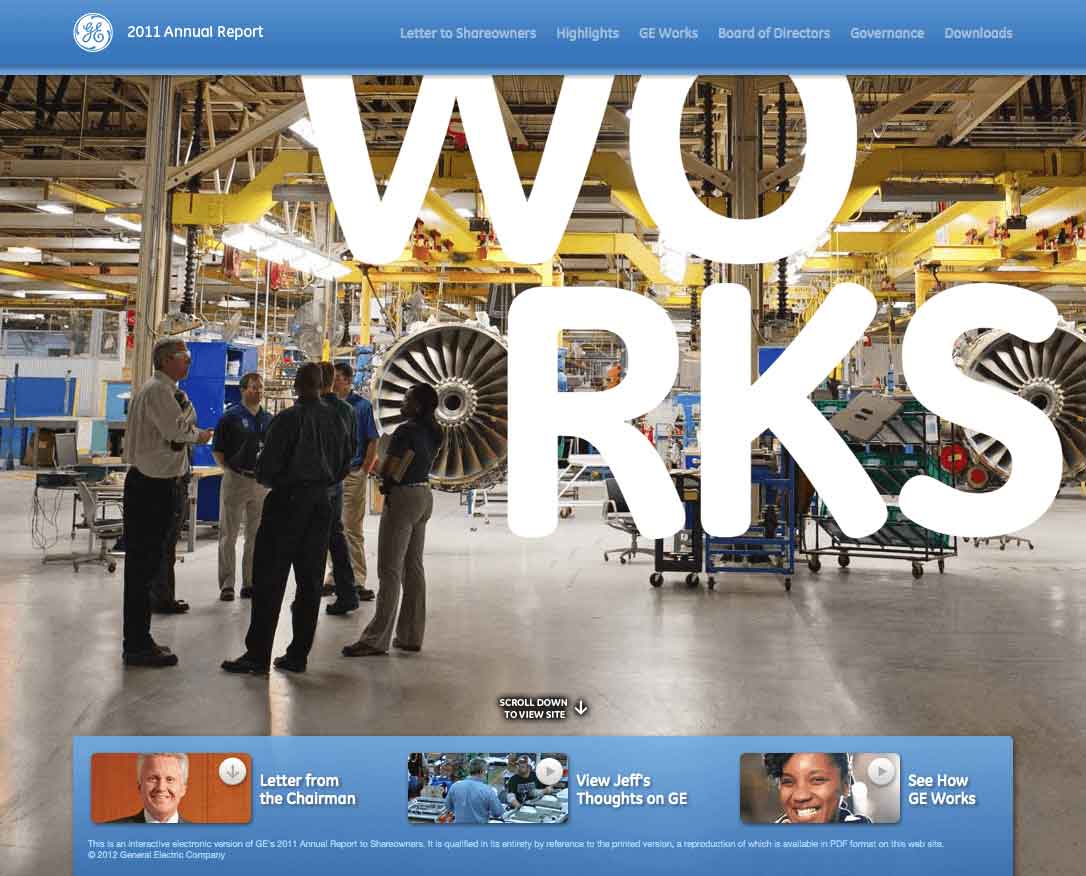 |
| (Screengrab from GE’s 2011 interactive annual report website, via GE.com) |
GE
GE’s 2011 online annual report uses parallax web design to share a letter from its chairman, charts of financial highlights and strategic goals, and an interactive look at the company’s leadership team. |
| (Screengrab from MailChimp’s 2012 interactive annual report website, via mailchimp.com) |
MailChimp
MailChimp’s 2012 online annual report tells a story of the company’s success through its scrolling, responsive design. Traditional bar charts and line graphs are supplemented with interesting factoids and on-brand yet playful illustrations.Looking for additional annual report inspiration?
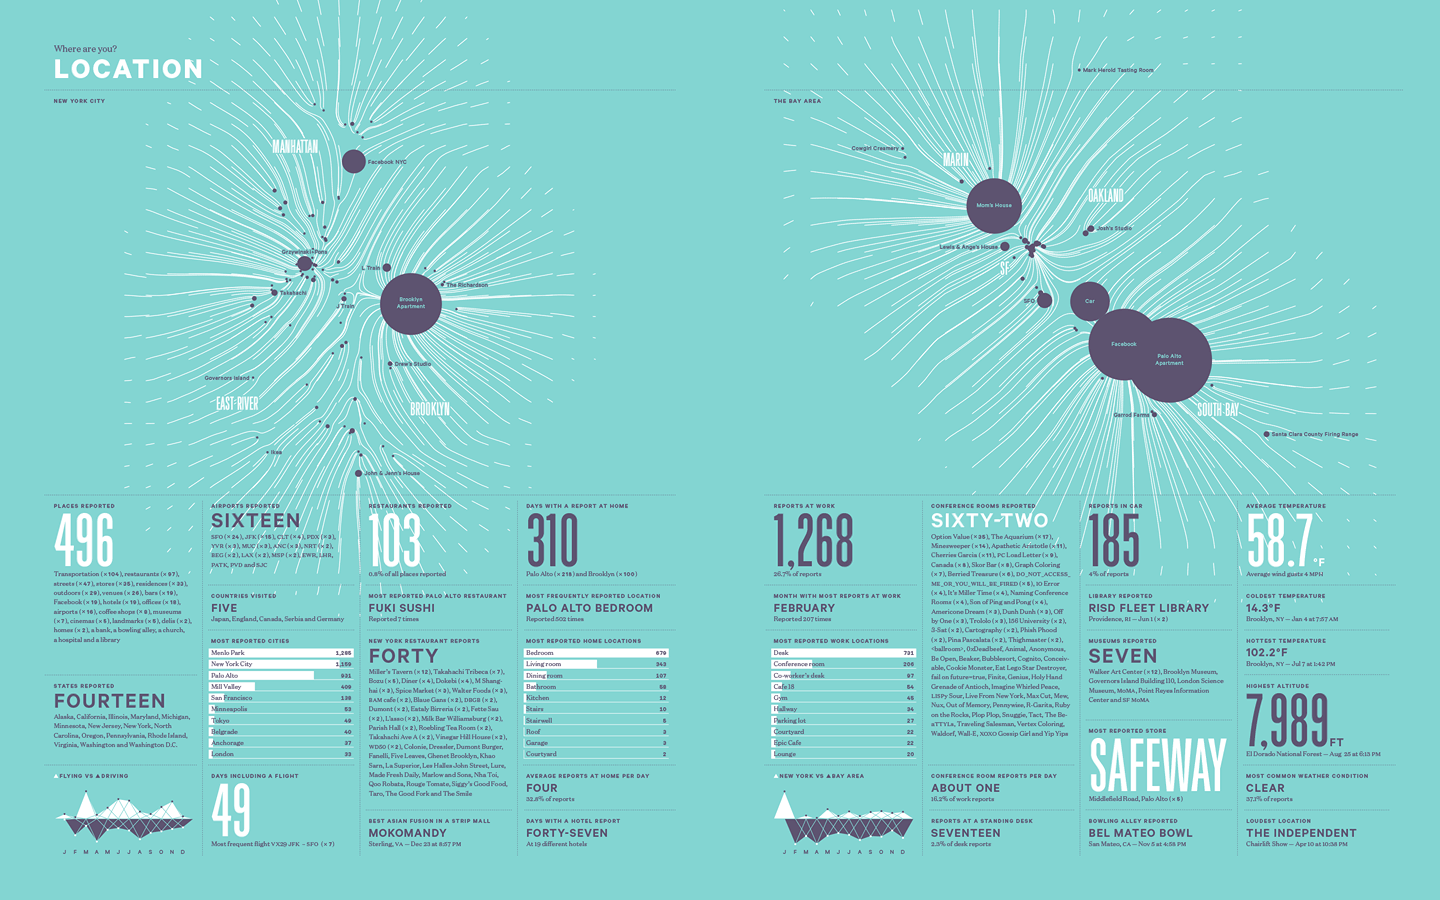 |
| (Image from the 2012 Feltron Annual Report, via Feltron.com) |
TBH Creative specializes in developing strategic websites.
Memorable online annual reports that effectively communicate your company’s achievements take planning.
Need help developing a strategic plan for your website? Contact us