By turning your annual report into an interactive website, you can engage your audience on a deeper level and generate interest in your company. Online annual reports make data easy to access and share, and can be more easily updated than other formats. They also give you the opportunity to use interactive content such as video or audio to enhance your data and provide a unique experience to viewers.
In this showcase, we’ve put together some fantastic examples of online annual reports that succeed at presenting data in an effective, engaging manner for their audience. Take a look and get inspired!
Crop Trust
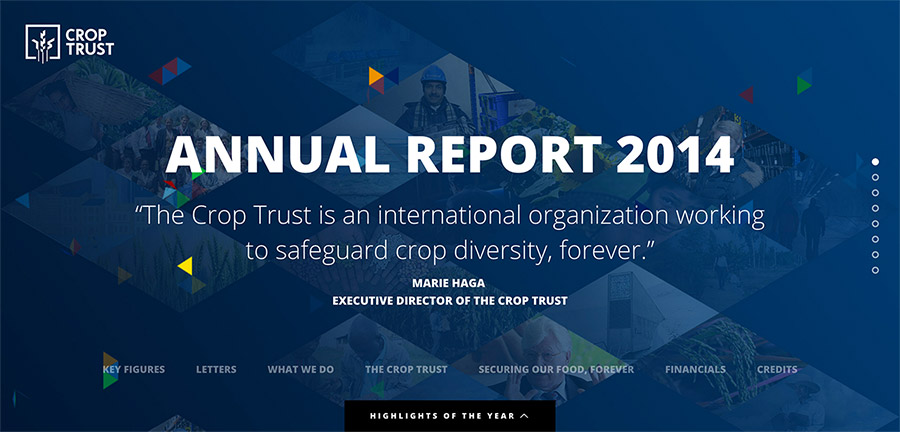
This annual report uses a variety of content types to display report data. It’s key figures are made more interesting through the use of graphics and animation. It links out to videos and articles to provide more information for each area as well, and even includes an interactive timeline of highlights from the year. View the report
Shopify
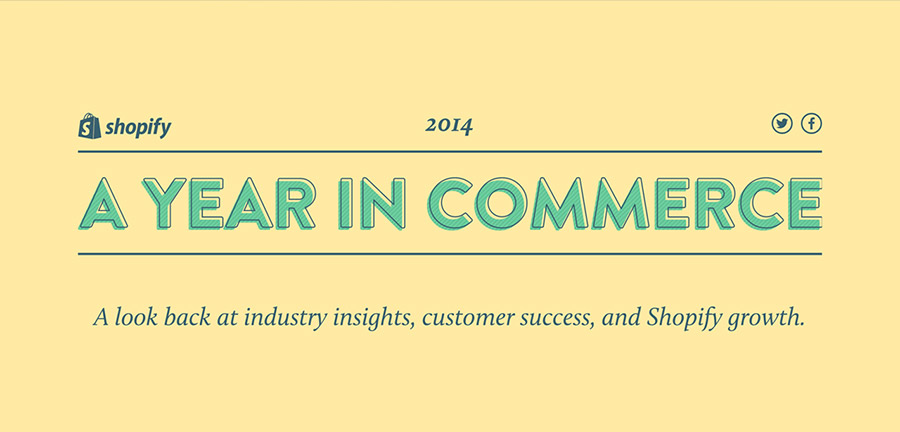
The Shopify annual report has a clean design that highlights content without appearing cluttered. It promotes user engagement with social media integration, including links that let users tweet various statistics. It also utilizes charts and graphs to display data in an easy-to-read manner. View the report
GE
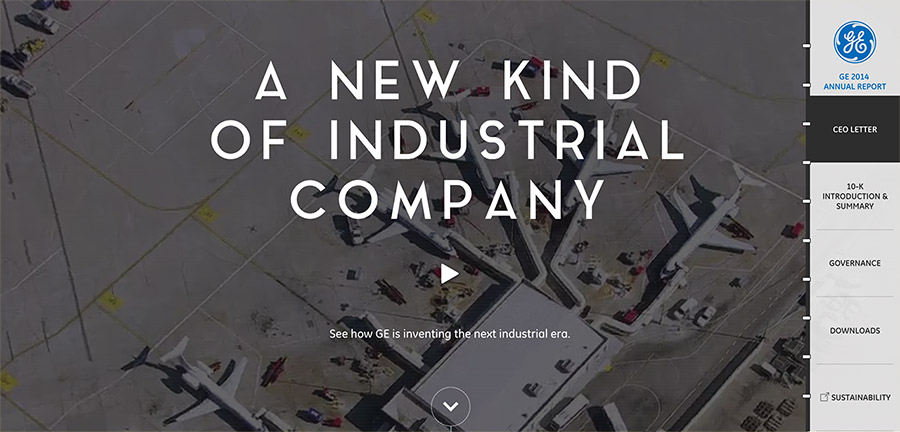
The GE report uses video front and center to engage it’s audience. The report is separated by sections, making it easy to navigate to specific information. It has an effective balance between content and imagery, and uses graphics to illustrate key information. The report also includes social sharing links throughout the content. View the report
Lemonly
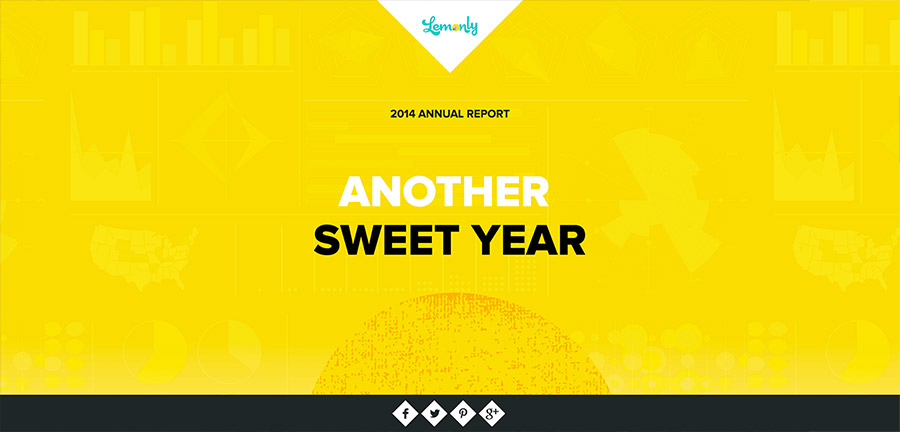
The Lemonly report is fun and interactive with illustrations and animations throughout. It also carries over design elements from the main website, which helps to reinforce the company’s brand. View the report
Charity Water
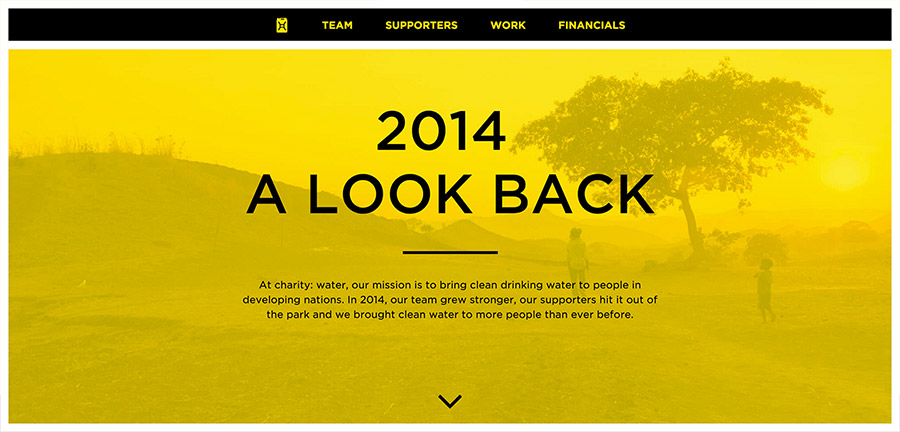
This is a simple but effective annual report that utilizes a one-page layout with scroll effects. It starts off with team statistics, making it more personable and better connecting with its audience. It effectively uses high-quality photography to enhance content and display accomplishments. View the report
Blue Cross Blue Shield of MA
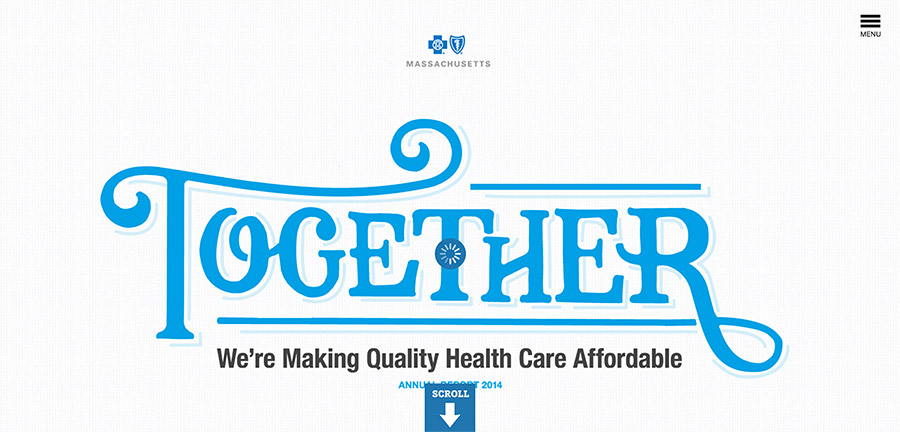
This annual report makes good use of video to connect with its audience, with the intro area including a fun video of its team members. It uses illustrated graphics and scroll effects to make content interesting and interactive.
More annual report inspiration:
- Echoing Green
- W.K. Kellog Foundation
- Thomson Reuters
Need help with your annual report? TBH Creative has the web strategy and design experience to help you create an effective and interactive annual report that will reach a wider audience. Find out more about how we can help.