
Have you ever found yourself asking, “why is my website so slow?” This is a frustrating experience for website owners, and it can be challenging to figure out how to fix a slow website.
If you feel your website is underperforming, aimlessly making changes in hopes it will improve speed is never an efficient approach.
Instead, start by gathering some real data. Some tools can help you measure your website’s speed and narrow down the most beneficial starting point for improvements.
Website performance is complex and multifaceted, but you don’t have to be an expert to get started with testing website speed. A basic understanding of how to use testing tools and interpret the metrics can go a long way. Even a high-level understanding of what the data means is helpful in assessing how you can improve your website.
In the article, you’ll learn about the importance of website performance, how to properly test your website, and how to interpret the results.
Why does website speed matter?
For many decision-makers, whether or not to invest in website improvements comes down to one fundamental question: ”Is this problem costing me business?” When it comes to poor website speeds, the answer is almost always, “yes!”
Improving the speed of your website has a multitude of benefits, such as better user retention and increased conversions. Consider these stats:
- 40% of people will leave a website that takes more than 3 seconds to load. (source)
- On mobile, as page load time increases from 1s to 5s, users are 90% more likely to leave before the page is fully-loaded. (source)
- The BBC found that they lost 10% of users for every additional second a page takes to load. (source)
- Pinterest saw a 15% increase in signup conversion rates by making performance improvements. (source)
A faster website improves the user experience, which will lead to better results. Investing resources in the continuous monitoring and improvement of website speed will make your users and stakeholders happy.
“When it comes to user experience, speed matters.”—web.dev
What tools should I use for website speed testing?
First, to figure out what’s slowing down your website, it’s helpful to understand exactly how a website loads. I highly recommend reading through MDN’s How the Web works for a clearer picture of what is happening behind the scenes when you load a website. To sum it up, various requests and responses happen between your browser and the server before a website fully loads, and a slow down in any of those moving parts can cause loading issues for your users.
Website speed testing tools measure and report various metrics that provide insight as to how much time each part of the loading process takes. Most tools will also provide various recommendations and suggestions as to what to fix on your website. Each service will differ in the exact data it provides, so it’s often helpful to conduct various tests to get the whole picture.
Here are some of the most popular speed testing resources:
- PageSpeed Insights (this uses Lighthouse, which can also be used through Chrome DevTools as well)
- WebPageTest
- Pingdom
You’ll start by entering a URL for assessment for each of these tools. Some also provide advanced options, such as device, browser, or location. Here are some other tips when setting up a test:
- To get accurate results, you’ll want to test using the options that best represent your website. If you can choose a location, select one that most closely aligns with your audience.
- Many tools provide both desktop and mobile speed information. If available to you, look at both sets of data. Mobile speeds are often slower and require more consideration.
- Don’t only test the homepage of your website. Look at your analytics to determine your top landing pages and test those as well. Most websites have different functions and features between pages that affect site speed differently, so test accordingly to get a more well-rounded assessment of your users’ experience.
Which testing tools you ultimately use will depend on your specific needs and goals, but a good tool to start with is typically Google’s PageSpeed Insights. Website performance metrics are a ranking factor for Google search, so focusing on their data is useful from an SEO perspective.
Many testing tools provide similar metrics that are useful no matter your website goals. Let’s look at what some of those key metrics are and how to improve them.
What are the key website speed metrics?
Here are some of the standard performance metrics that you should be familiar with:
- Load Time: The overall time it takes for a page to load
- Page Size: The total size of all assets required to load the page
- Number of requests: All requests made to the server by the browser, such as images, fonts, scripts, etc.
- Time to First Byte (TTFB): The time it takes for the browser to receive the first byte of content from the server
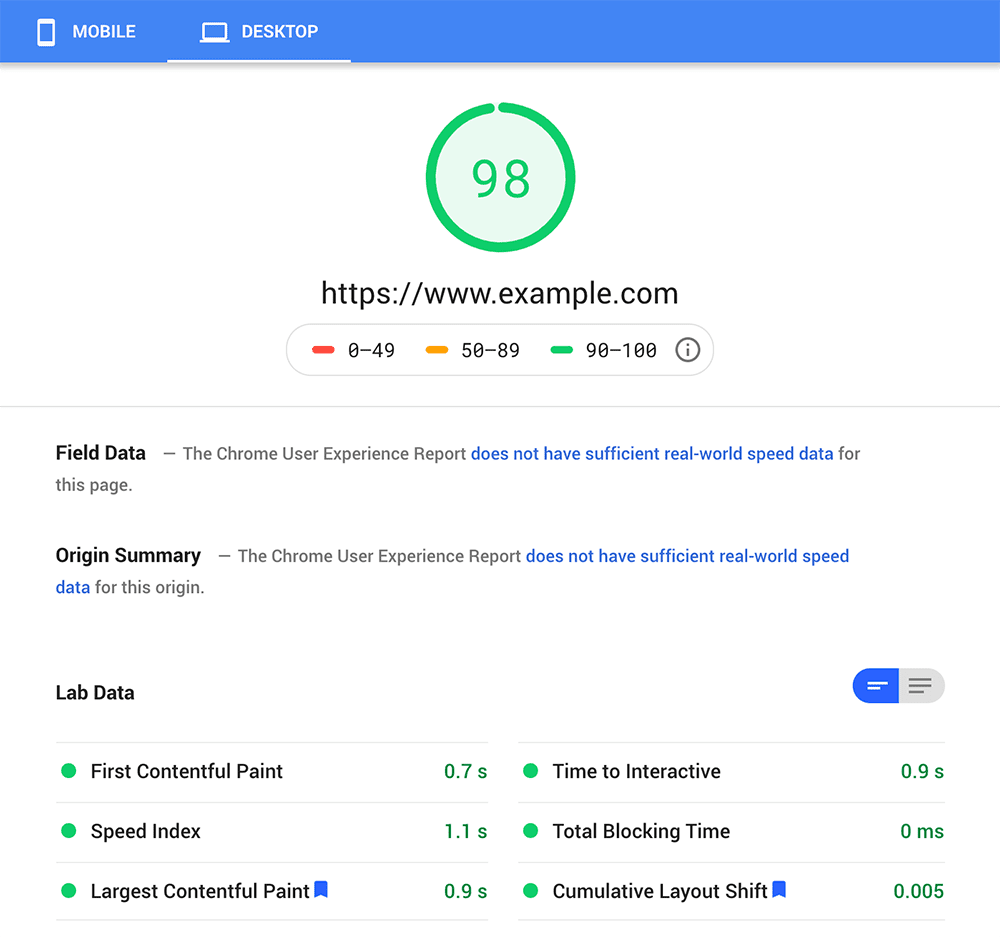
- First Contentful Paint (FCP): How long it takes for a user to see the first bit of content on the screen
- Time to Interactive (TTI): The time it takes for elements on the page to become usable
- Total Blocking Time (TBT): How long users are blocked from interacting with page elements
Also, Google recently announced what they call Core Web Vitals, which are a collection of metrics that “measure dimensions of web usability such as load time, interactivity, and the stability of content as it loads.” These web vitals include:
- Largest Contentful Paint (LCP): The time it takes for the largest image or text block to appear within the viewport
- Cumulative Layout Shift (CLS): Measures the amount of layout shifting during page load
- First Input Delay (FID): How long the browser takes to start responding when a user interacts with the page

After collecting the data, it might not be obvious whether or not the measurements you receive are “good.” Most testing tools will provide some type of insight as to what numbers are acceptable, whether it’s providing an overall grade or comparing to related industry data.
Scoring can also be somewhat subjective depending on your site’s content, target audience, website goals, and so on. You might consider speed testing competitor websites to see where you are in comparison. Additional research may be required to properly assess a baseline for data if not provided by your testing tool of choice.
As a starting point, check out Google’s information on metrics to determine the overall recommended guidelines.
How do I improve my website’s speed metrics?
Now that you have some data and a better understanding of each metric, you’ll need to identify opportunities for improvement. Fortunately, most testing tools make this easy by noting possible issues and recommendations. Take the time to look through any insights provided and related documentation.
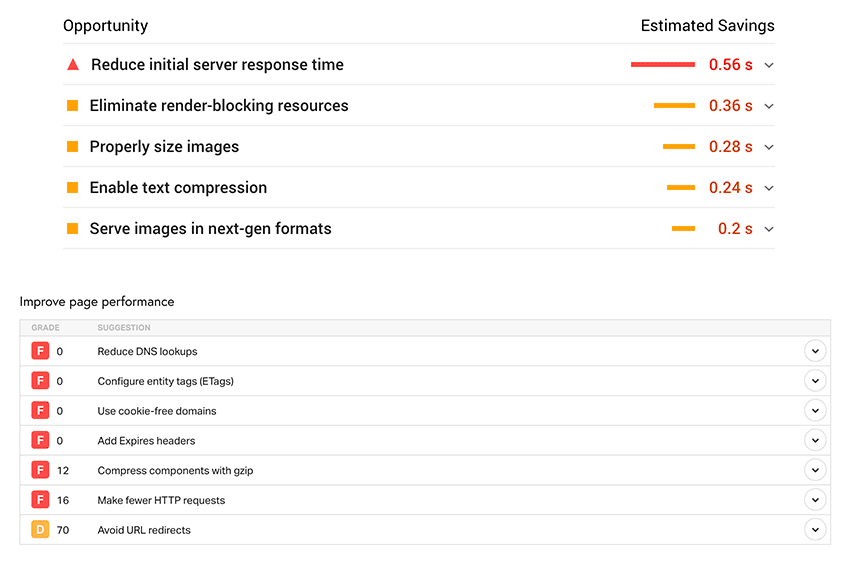
Below are some of the most common culprits of slow website speeds and which metrics they affect.
- Server speed: A slow server response will negatively impact several metrics, including TTFB and LCP. Look into options for optimizing your server and any database queries to ensure a quick response, specifically around compression and caching.
- Redirects: Redirects can increase the TTFB, so use sparingly and eliminate where possible.
- Images: Images are one of the most significant contributors to large page sizes and can increase the LCP time. Make sure you are optimizing dimensions and file sizes for all website images.
- Web fonts: Loading in many web fonts on a page can increase the FCP if a visible fallback is not in place. Limit the number of web fonts and follow best practices for web font optimization.
- Styles and scripts: Code files that are loaded before content will temporarily block loading and are referred to as “render-blocking.” These render-blocking assets will increase your FCP and LCP metrics, so keep them limited and ensure all assets are properly compressed. Scripts loaded in after content should also be properly optimized to load as quickly as possible, as the longer it takes for any functionality to load, the higher your TTI, FID, and CLS metrics will likely be.
- Third-party code: Other third-party assets like tracking codes, plugins, or widgets can increase load time significantly if not managed properly. Be aware of what scripts you’re loading into your site and adjust settings where possible to optimize.
From here, create an action plan for tackling any problems. This is likely where you’ll want to loop in your web or IT team to confirm technical details and develop realistic goals. Depending on what resources you have available, you’ll need to prioritize any fixes needed.
Keep in mind that there’s typically some trade-off between site features and performance as well. For example, if a third-party tracking code is lowering page load time but is crucial to your marketing strategy, you might accept that as a necessary trade-off to support your business goals.
It’s usually best to first tackle the easy items or the changes that will have the most significant impact for the lowest effort. For example, optimizing images or enabling caching might be a more realistic first step than changing your hosting provider.
Make sure to do another round of testing after any changes are made to measure their impact and better inform future performance decisions. It’s often a case of trial and error to find which adjustments will be the most effective for your website.
Overall, this should be an ongoing process to continuously improve website speed. The more dynamic your website is, the more frequently site speed can change, so you’ll want to monitor performance closely to get ahead of any potential issues.