
You’ll often hear content marketing experts espouse the importance of storytelling for reaching new customers, especially during this era of “big data.” Many focus on the power of words, but choices you make about photography, illustrations, CTAs, typography, color, layouts, and even data visualizations will shape the messages you send through content.
Data-driven storytelling is more than just publishing hard data in basic charts and graphics. When done well, it gives voice to facts. Great visual presentations of data create an engaging narrative that supports other parts of your overall marketing campaign. From how you label a chart to which data points you extract and pick for inclusion, every detail can influence what story your visualization tells your customers.
The best data visualization examples are transformational. They add interest and appeal to target audiences while building, keeping, and growing credibility by clearly communicating relevant, accurate insights. On the other hand, poorly designed infographics fail because they mislead and create confusion.
According to research on visual aids by Stanford University’s Robert Horn, communications that combine “visual and verbal presentations are 17% more convincing than those using verbals alone.” Or, to put it more simply: Great data visualizations, when paired with written information, can help you get more significant results.
Read on to learn more about the benefits of incorporating data storytelling into your marketing and learn 5 secrets for creating impactful data visualizations.
The power of data visualizations
Journalist and designer Alberto Cairo wrote, “Any chart, no matter how well designed, will mislead you if you aren’t paying attention.”
Overcoming consumer skepticism is a big marketing challenge. Making false claims in advertising isn’t a new practice. Still, the advent of social media has helped misleading information (in the form of data visuals) spread faster than it ever has before.
That’s why it’s more important than ever to ensure any data visualizations your company creates and shares are as accurate as possible to help you build trust and remove any doubts held by potential and existing customers.
5 things you can do to create better data visualizations
Give your customers the numbers they need during their buyer journey to support their decision-making. Here are five ways to improve your data visualization creation process to make sure you design visual aids that support your marketing goals:
- Pick the right metrics
- Choose the best format
- Balance simplicity and accuracy
- Make your data relatable
- Summarize key points
Pick the right metrics
Think of metrics as characters in your company’s story. Picking the right set of metrics requires finding the intersection of what is actionable, accessible, and has a common understanding.
You can use tools—like HubSpot, Google Analytics, Excel, Facebook Insights, etc.—to pull information that makes the most sense for your intended data visuals.
Choose the best format
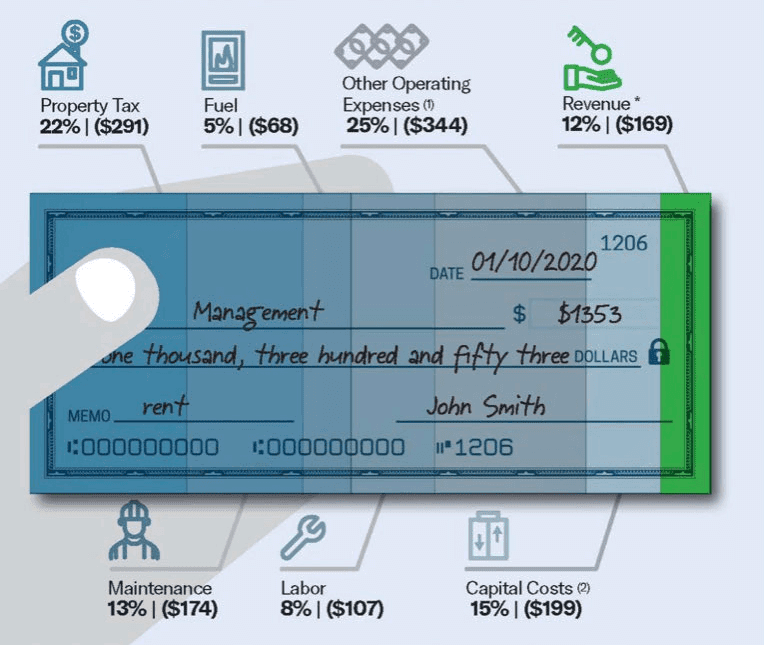
Your data story design should be as straightforward as possible to ensure your message comes through without distraction, and choosing an appropriate format is the best way to get this done. For example, pie charts are a great option when designing a parts-to-whole comparison—unless you’re working with data broken up into more than five categories.
If you fear your visual aid to present your data has too much going on and worry that your audience may struggle to understand what you’re presenting, take a step back. An audience should be able to look at your data storytelling graphic and know what’s going on without excessive explanation.
Following a modified version of legendary designer Coco Chanel’s advice for how to dress provides excellent guidance for finishing any graphic: “It is always better to be underdressed underdesigned. Before you leave the house publish a data visualization, look in the mirror at it and take one thing off off one non-essential flourish.”
Balance simplicity and accuracy
You don’t want to create a data visualization that’s so complex it overwhelms your audience. On the other hand, sometimes, when you abridge your data too much, the absence of some information can befuddle your audience (at best) or break their trust (at worst). The key is to find the right balance.
Make your data relatable
When creating written web content, you need to cover the “who, what, where, when, why, and how.” The same holds true when you’re doing any data storytelling. In fact, the last two are most essential to keep in mind:
- Why should your audience care?
- How does this relate to them?
Summarize key points
Every visual data story should include direct, logical takeaways. Data visualizations should also get your customers thinking and talking. They shouldn’t end conversations but be the reason why discussions continue.
Strip away ornamental elements that get in the way of understanding
Great storytelling with data speaks volumes by clearly presenting information—without compromising integrity. It supports technical analysis and decision-making while revealing key points succinctly.
FAQs about data visualizations
Creating visuals using data can be complicated. Here are some answers to frequently asked questions about creating effective data graphics.
What are some different types of data visualization?
The best visuals for presenting hard data make information easier to understand. Some of the most popular formats for data graphics include:
- Charts
- Tables
- Graphs
- Maps
- Infographics
- Dashboards
What is the best data visualization tool?
The ten most popular data visualization tools are:
- Tableau Public
- Tableau Gallery
- Microsoft Power BI
- Google Data Studio
- Openheatmap
- Leaflet
- Datawrapper
- Chartbuilder
- Information Is Beautiful
- Open Refine
Is data visualization easy?
It depends. Good examples of data graphics require a careful balance of form and function with messaging.
Designers can’t always simply take a data set with thousands of entries and create a visualization from scratch.
What is cherry-picking?
Cherry-picking describes the misleading practice of creating data storytelling that disregards some data and only presents findings that support the creator’s intended message or position.
Take your data visualization projects to the next level
Here at TBH Creative, we’re experts at making data more understandable. Our team can help you find the best ways to visually present your data.
Don’t let numbers scare you. Great data visualizations can add a punch to your annual reports, web pages, social media post artwork, and more if you leverage their insights with graphic presentations representing your company and brand messaging.