Both website analytics and marketing analytics are an integral part of your company’s digital strategy success. That’s probably not news to you. But, what might be news is that there are a wealth of free, online analytics tools available to you right now.
Many people forgo a regular analytics-review routine simply because they don’t know where to start. In this post, we are going to go in-depth into one web analytics tool and one marketing analytics tool that can be used individually, or together.
Read on to learn about how Google Analytics and Facebook Insights can inform your web and marketing efforts in big ways.
This article is part of the Complete Guide to Planning a Success Website Redesign Project.
The two different types of analytics: web analytics vs. marketing analytics
So what is the difference between web analytics and marketing analytics? And, how do they work together?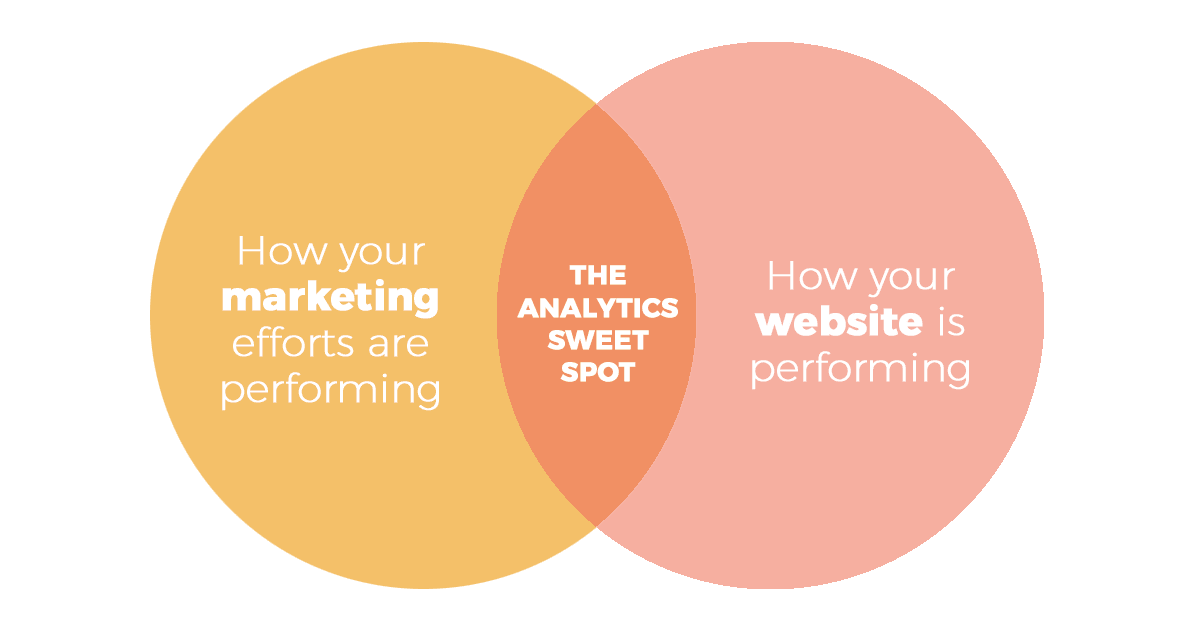
Put simply, you can use web analytics to measure s the classic key performance indicators (KPIs), such as the total number of visitors to your website, bounce rate, conversions, etc.
Marketing analytics goes a little deeper. You can use this data to try and paint a full picture of your inbound marketing efforts, such as which marketing channel is earning the most engagement, what type of content is getting the most shares, etc.
At the crossroads of web and marketing analytics is the sweet spot, the precise area where you can see specifically which marketing efforts are driving the most traffic on your website. The first step you should take is to start using Google Analytics to monitor your website metrics. This will help you become aware of your website’s traffic trends. Then, use Facebook Insights to weave in marketing analytics data to uncover information about which of your marketing efforts are delivering the best results.
Let’s take a closer look at our first recommended tool, Google Analytics.
Get started with Google Analytics
Perhaps the most basic, yet powerful analytics tool every website owner should use is Google Analytics. From “how many people visit my site?” to “what kind of content is the most popular?,” Google Analytics has the answers.The first step is to install a tracking code into your site. Google provides a helpful step-by-step guide on how to incorporate their tracking code snippet into various types of websites.
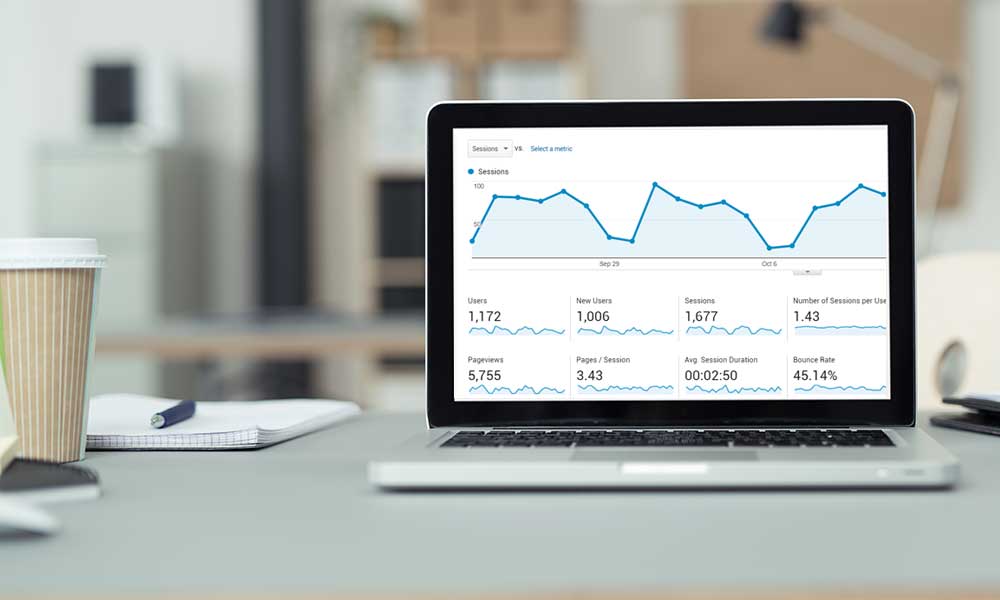 |
| Example of a Google Analytics dashboard view |
From “how many people visit my site?” to “what kind of content is the most popular?,” Google Analytics has the answers.
Metrics that matter: Visitors Devices & Page Views
Your Dashboard is a crucial tool when you’re beginning to evaluate your website’s performance. It can even tell you how many users are currently on your site (and which pages they’re reading). It is a great initial resource and contains two important metrics you should keep an eye on: what types of devices your audience is using to access your website and what pages they visit the most.Keeping track of the number of users visiting your site from a mobile phone can provide an answer to the question: “Do I really need a mobile site?” Additionally, you can use your Dashboard to get an understanding of the type of content your audience gravitates toward can give you some idea as to what to promote in your marketing, and what to produce more of in the future.
Combining Google Analytics with Facebook Insights
Another important measurement Google Analytics logs is called Referrals. This report tracks where users are being sent to your site from. If you navigate to Acquisition > All Traffic > Referrals, you can see from where most people are coming to your site.Usually, you can expect to see Google as the main driver. This becomes more likely as you improve your SEO and achieve a higher search ranking.
You can fine tune this feature by using the search bar. We love it because of how well it meshes in with our second free tool, Facebook Insights. When we create social media reports for clients, we use this combo to analyze how many people came to a client’s website from their Facebook page. This way, we can gauge the value of their Facebook efforts and fine-tune their processes.
#ProTip: Combine Google Analytics with Facebook Insights for full view of your digital performance.Tweet thisType “Facebook” into the search bar on the Referrals page to filter for only site visit through Facebook. Something to note: m.facebook.com is the address of Facebook for mobile. If you see this at the top of your results, it’s a good sign that now is the time to optimize your website for mobile screens.
You can even get really granular with it and set the date range for when you ran a specific campaign on Facebook to see if there was any spike in website traffic from Facebook during that time. Overall, it’s a great tool to help you better understand what is going on behind the scenes and figure out what direction you need to go in for the future.
Want to learn more about Google Analytics?
Get started with Facebook Insights
While marketing analytics encompass more than just social media channels, in this post we are going to focus on using Facebook Insights as a marketing analytics tool. Facebook is one of the most widely-used—and most lucrative—advertising channels for virtually every type of business. Not only can you engage with a large audience for minimal to no cost, you can track and analyze your efforts with their powerful Facebook Insights tool.Metrics that matter: Post Engagement, Reach, & Page Views
Similar to Google Analytics, Facebook Insights shows your results in an easy-to-read dashboard that provides a high-level overview of the most significant data points. The most important metrics to keep an eye on in your dashboard are post engagement, reach, and page viewsThese three metrics can work together to show how well your Facebook marketing efforts are performing. Unsurprisingly, you want post engagement always be growing. Based on Facebook’s timeline algorithm settings, Facebook Pages that post highly-engaging content are favored (meaning they are more likely to show up) on a user timelines.
As post engagement increases, you should see an increase in reach. Reach is the number of users that saw any of your Facebook Page posts– basically, the total number of screens you got on during the time frame. The hope is that as Reach increases, more people are feeling compelled to go to your Page (and then ultimately your website).
This can be tracked by monitoring page views, and our other favorite free tool (Google Analytics). If you see your page views increasing on Facebook, and your website referrals from Facebook on Google Analytics should be increasing as well. That’s how you’ll know your Facebook advertisements are doing their job.
Don’t wait to start informing your marketing strategy
Even a light amount of analytics is better than no analytics altogether. By utilizing these two free tools, you’ll be able to start making more strategic decisions about content you share as part of your digital marketing strategy. The key is to track the data captured by these tools, synthesize it, and create something meaningful out of it for your process.Let’s talk about your analytics