
How to make data reports visually engaging to convey important data metrics to stakeholders
Data is everywhere.Cars measure the time before you need an oil change and the fuel efficiency of your recent travels. Watches count daily steps and the number of hours you slept last night. Banks, restaurants, coffee shops, and grocery stores tally up purchases and share rewards point totals and percentages saved during each shopping trip.
Data is even more ingrained in our professional lives.
This article is part of the Complete Guide to Planning a Success Website Redesign Project.
In marketing, one of the more difficult tasks to is presenting this type of data effectively. At TBH Creative, we often use reports to show a return on investment for inbound campaign efforts and more. Whether you’re tracking conversions, impressions, customer lifecycle stages, or other tangible metrics, at the end of the day everyone wants to know the same thing: are the hours and budget dollars we spend on marketing resulting in higher revenues for the company?
If figuring out how to effectively present marketing data puts you in a cold sweat, try some of the techniques we’ve found work.
Visual, appealing reports go a long way, painting a picture of performance that your boss (and her boss) can easily understand and discuss. A spreadsheet with sums and tallies isn’t going to cut it anymore. When sharing data with shareholders or team members, follow these three tips:
- Use visuals, such as colorful charts or icons
- Be selective about key performance indicators tracked (and make sure they add value)
- Balance data displays with text descriptions or interpretations
Facebook Insights dashboard
One of the key functions of the Facebook Insights dashboard is to show comparison data—at a glance—of performance over time.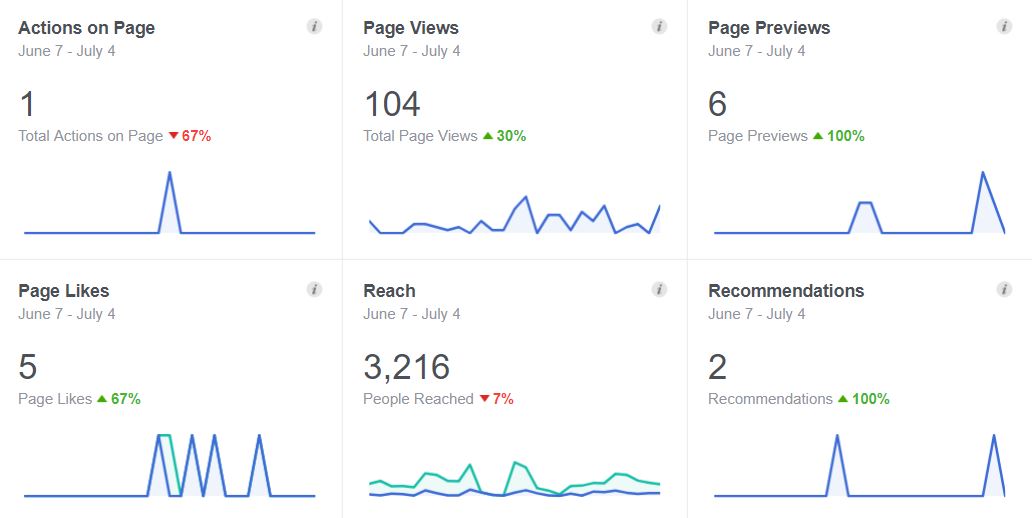
To create a report that presents big picture information clearly like Facebook Insights, make sure it includes:
- a grid view to show important metrics simultaneously
- simple red and green color designations to indicate which metrics have increased or decreased over the specified time period
- simple, bold labels for easy identification of data types
Google Analytics reports
While Google Analytics gives its users a variety of reports and views, the automated report section provides a great high-level of traffic and more.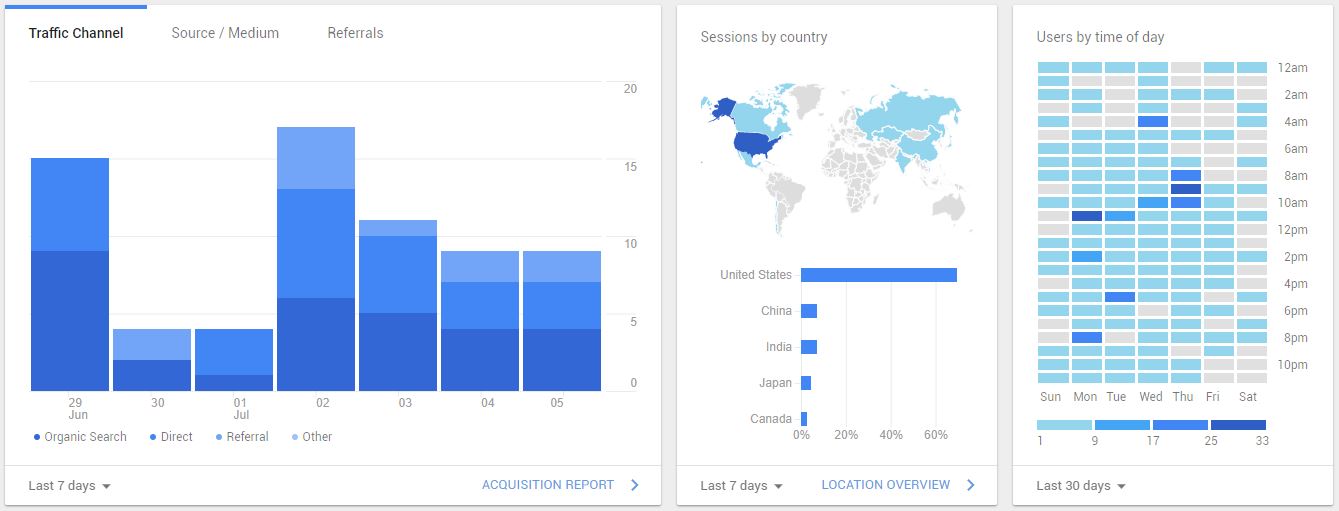
To make your report more engaging using tactics like those used in the Google Analytics overview dashboard, make sure it includes:
- consistent use of colors for a cohesive look that doesn’t overwhelm
- chart types appropriate for different types of data
- groupings of related data sets
HubSpot traffic charts
HubSpot use a classic line chart to present traffic data over time from various traffic sources.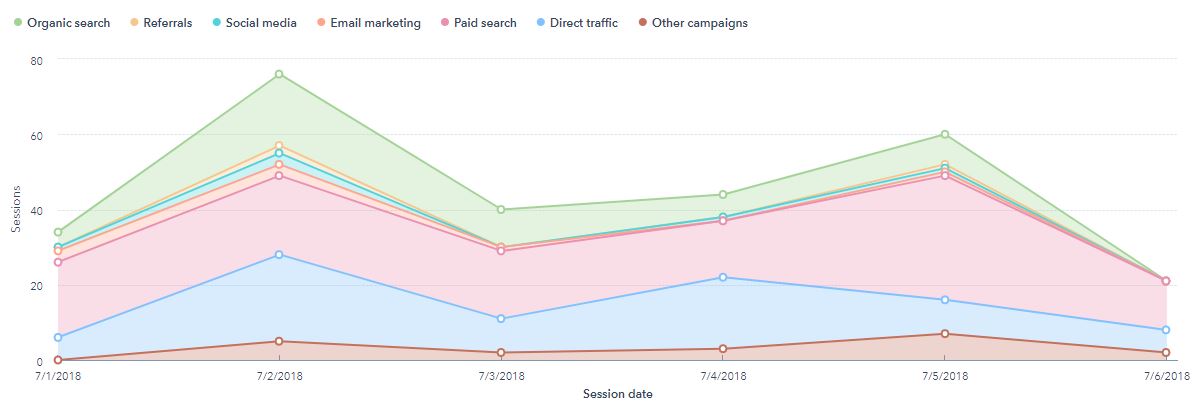
If you’re building a report that mixes together different types of data, follow HubSpot’s lead and make sure your graphic includes:
- left and right chart axis with clear labels
- distinct color values to make analysis easier
- a clear key to describe values represented in the chart
FitBit dashboard
FitBit’s personal dashboard gives users the chance to review several metrics at a glance. All data points are presented simply and marked with clear labels.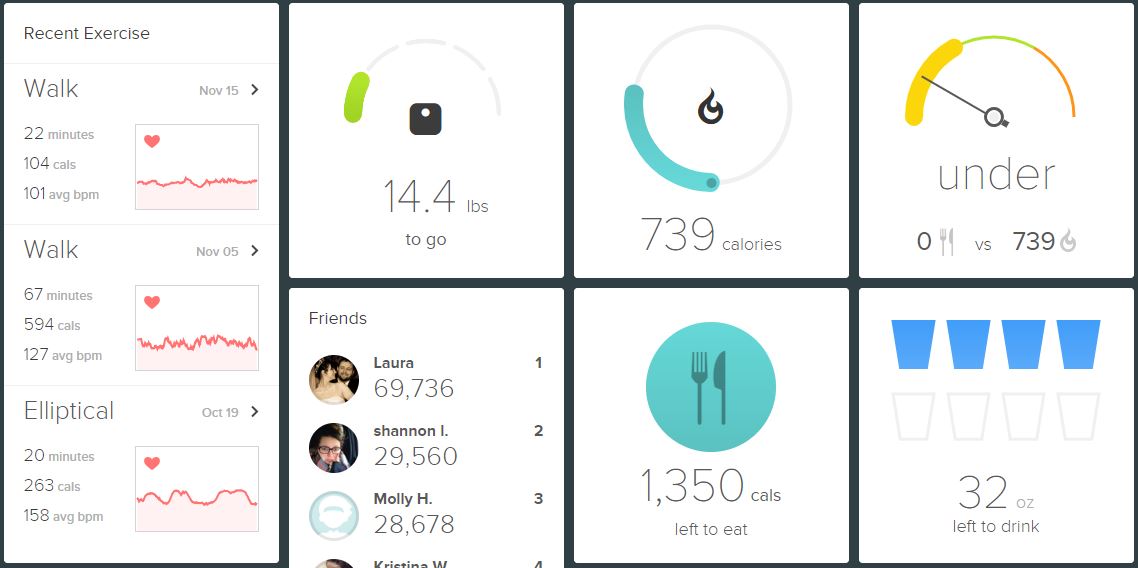
To create a visually appealing presentation of multiple data points like FitBit, make sure your report incorporates:
- icons, as appropriate, to represent progress in data sets
- simple tile layouts with ample white space
Mint budgeting tools
The Mint’s spending trends piechart uses vivid color and clear labels to clearly display spending proportions.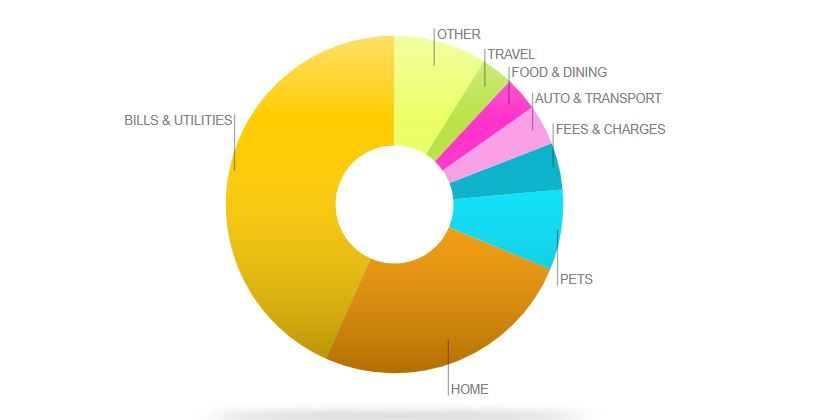
To mimic the Mint, tweak your report to include:
- a classic piechart if you’re showing how different parts work together
- distinctive colors to easily separate each section of your piechart
- clear labels for each section of your piechart
Often when presenting data, less is more.
Consider including additional notes as part of your presentation but keeping the visuals clean and simple to allow your audience to focus on the metrics you have highlighted. These data presentation examples will help you to show the data metrics more effectively, but how you tell is also very important.
Keep campaign goals in mind when you prepare reports and be sure to highlight metrics that are important to stakeholders and that demonstrate return on investment.
How we can help you get more from your marketing in 2018? Let’s talk
You might also like: